The Data Bridge: Transforming Your Analytics Dashboard from a Graveyard into a Strategy Map
Most chatbot dashboards answer one easy question: "How many conversations did we have?"
That number is comforting. It is also useless the moment someone asks the real questions:
- Why did handoffs spike on Tuesday?
- Which topics are quietly burning support time?
- Which campaigns bring great chats but terrible leads?
- What changed after we updated the bot last week?
This is how dashboards become a graveyard: lots of charts, very little action.
The fix is not "a better dashboard." It is a data bridge.
This guide explains how to do that with HoverBot analytics, integrations, and an API-ready approach without drowning in technical plumbing.
Why chatbot dashboards die
They die for three boring reasons:
- They stop at counting: chats, messages, users. No causes, no next steps.
- They live in the wrong place. Your executive dashboards live in BI. Your chatbot dashboard lives somewhere else.
- They do not change behavior. Insights do not feed back into routing, knowledge updates, or support playbooks.
A strategy map fixes all three. It is not about more metrics. It is about better decisions.
The data bridge idea
Think of your chatbot like a new hire.
If all they can say is "I talked to 1,200 customers," you cannot coach them. But if they can tell you what people asked about, where they got stuck, when they needed a human, and what happened after, you can train them like you train a team.
That is what the data bridge does. It turns conversations into signals you can manage.
What matters more than chat volume
You do not need fifty metrics. You need a small set of outcome signals that explain the story quickly.
Here is a practical set that works across most teams:
- Outcomes: resolved by bot, handed to human, dropped, completed
- Topics: what users asked about, and what topics drive escalations
- Quality: no-answer moments, repeat questions, and basic feedback signals
- Speed and cost: where flows slow down, and whether costs spike for the same outcomes
- Safety: how often privacy protections are triggered, and whether guardrails block too much
This is what turns analytics into decision-making.
Three ways businesses connect bot analytics to BI tools
There are many ways to wire systems together. In practice, they fall into three simple patterns.
1) Scheduled reporting
Once a day or hourly, pull HoverBot analytics into your reporting system.
Best for: teams that want a quick start and do not need real-time alerts.
2) Real-time updates
HoverBot sends key events as they happen into your systems.
Best for: "something changed" moments, like a handoff spike or sudden rise in no-answer events.
3) Full-scale streaming
High-volume, always-on pipelines for large companies.
Best for: mature data teams and big scale.
Most companies start with scheduled reporting, then add real-time updates for the handful of moments that matter.
The three dashboards that actually move the business
1) Support Control Room
For: Head of Support, Ops Manager
What it answers:
- What are the top reasons customers still need humans?
- Which topics cause the most escalations?
- What changed this week compared to last week?
- Where should we update the knowledge base first?
What it changes:
- Staffing plans
- Escalation playbooks
- Content priorities
2) Growth Radar
For: Marketing and Sales leaders
What it answers:
- Which pages and campaigns drive conversations that convert?
- Where do users drop off before leaving details?
- Which chatbot flows produce higher-quality leads?
- Are we getting curious clicks or real buyers?
What it changes:
- Campaign targeting
- Landing pages
- Lead qualification questions
- CRM routing rules
3) Engineering Quality Map
For: Technical leads and developers
What it answers:
- Where does the bot struggle (no-answer clusters)?
- Which updates improved outcomes, and which made things worse?
- Are guardrails too strict or too loose?
- Are we spending more than expected for the same outcomes?
What it changes:
- Routing logic
- Model choices per use case
- Knowledge ingestion priorities
- Release confidence
The most important part: closing the loop
A data bridge is only valuable if it feeds back into action.
The best teams run a simple weekly loop:
- Review top handoff topics and no-answer topics.
- Pick the top three fixes.
- Apply them inside HoverBot by adjusting routing, updating knowledge sources, improving key flows, and tuning guardrails.
- Measure impact the following week.
This turns your dashboard into a map because it changes where you go next.
A quick note on trust: analytics without privacy drama
If your bot handles sensitive information, you want analytics that are safe by default.
The goal is simple: track patterns and outcomes without turning your analytics tool into a storage locker for personal data.
HoverBot-style PII handling makes it possible to measure what matters, including frequency of PII events, without exposing the sensitive parts.
The Monday morning test
Here is the easiest way to tell if your analytics dashboard is alive. On Monday morning, can you answer quickly and confidently:
- What changed last week?
- Why did it change?
- What are we doing today because of it?
If you need screenshots, manual exports, or a Slack archaeology expedition, you do not have analytics. You have a graveyard.
Build the bridge.
About the author
HoverBot TeamAI Product Engineering Team
Cross-functional team of AI engineers, product managers, and support operators building customer-facing chatbot systems in production environments. We ship weekly releases informed by production telemetry, closed-loop conversation reviews, and benchmark-driven evaluation cycles.
- Customer support automation and intelligent routing systems
- RAG pipeline design and guardrails for regulated workflows
- Operational analytics and closed-loop quality improvement
- Multilingual NLP and entity-level PII masking pipelines
- Production deployments across e-commerce, real estate, and SaaS verticals
Share this article
Related Articles
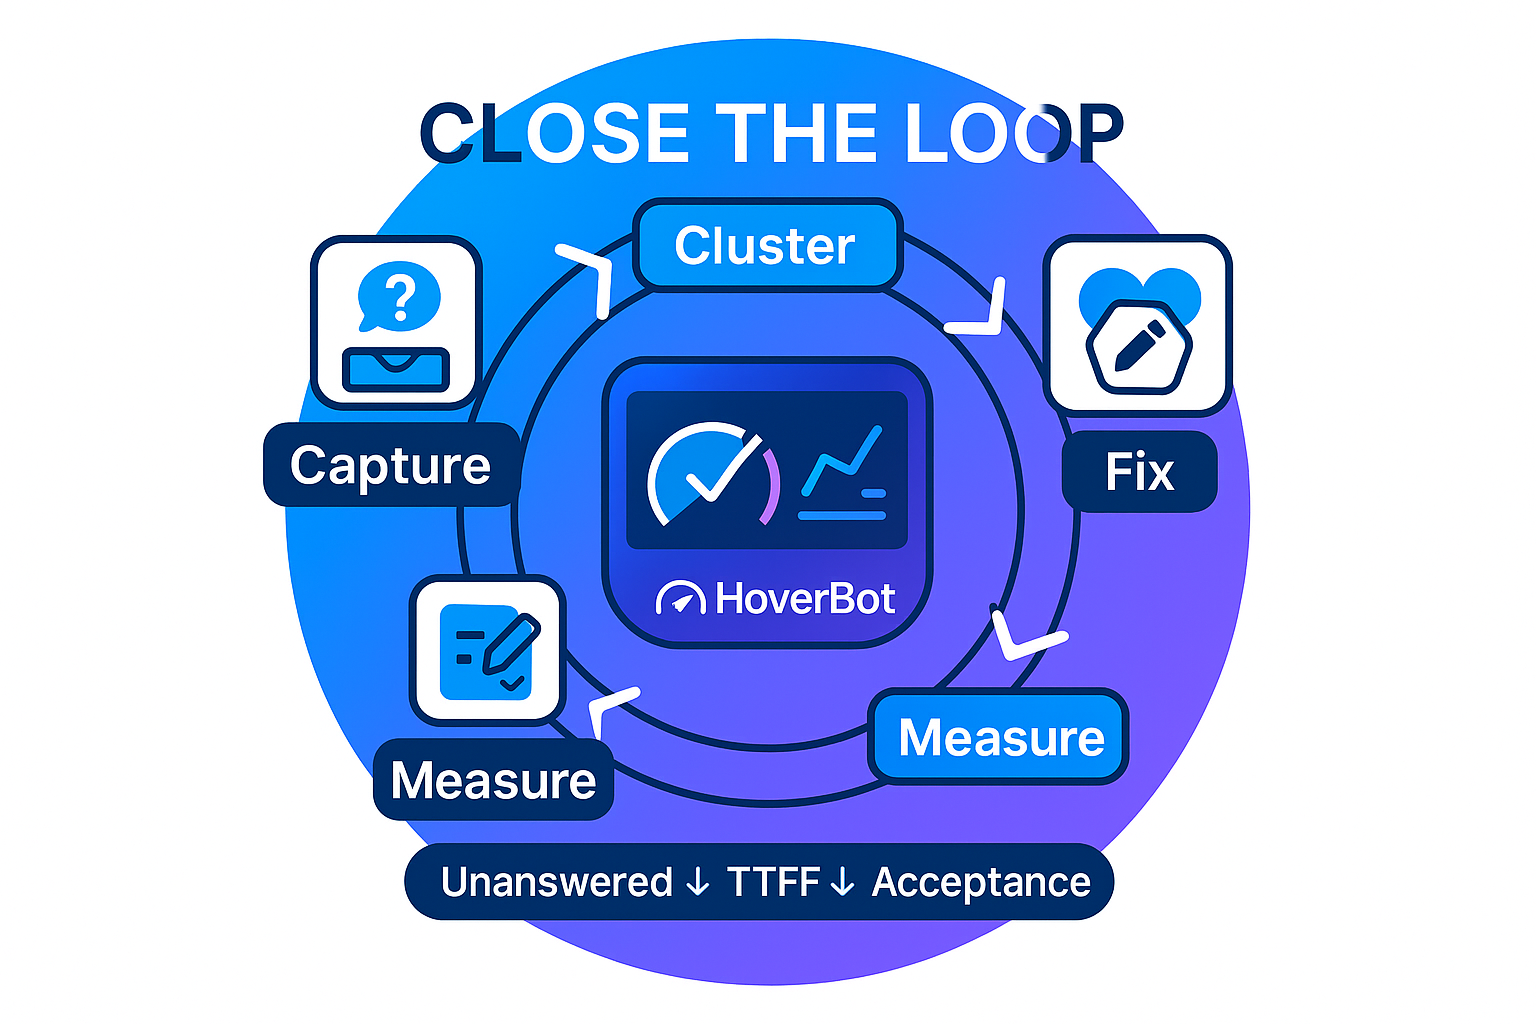
Close the loop: analytics that teach your chatbot to fix itself
Many chatbots stall for the same reason. Unanswered questions build up and nothing changes. Learn how to capture every miss as a signal, turn real gaps into small updates, and run a weekly improvement loop that delivers results without bigger models.
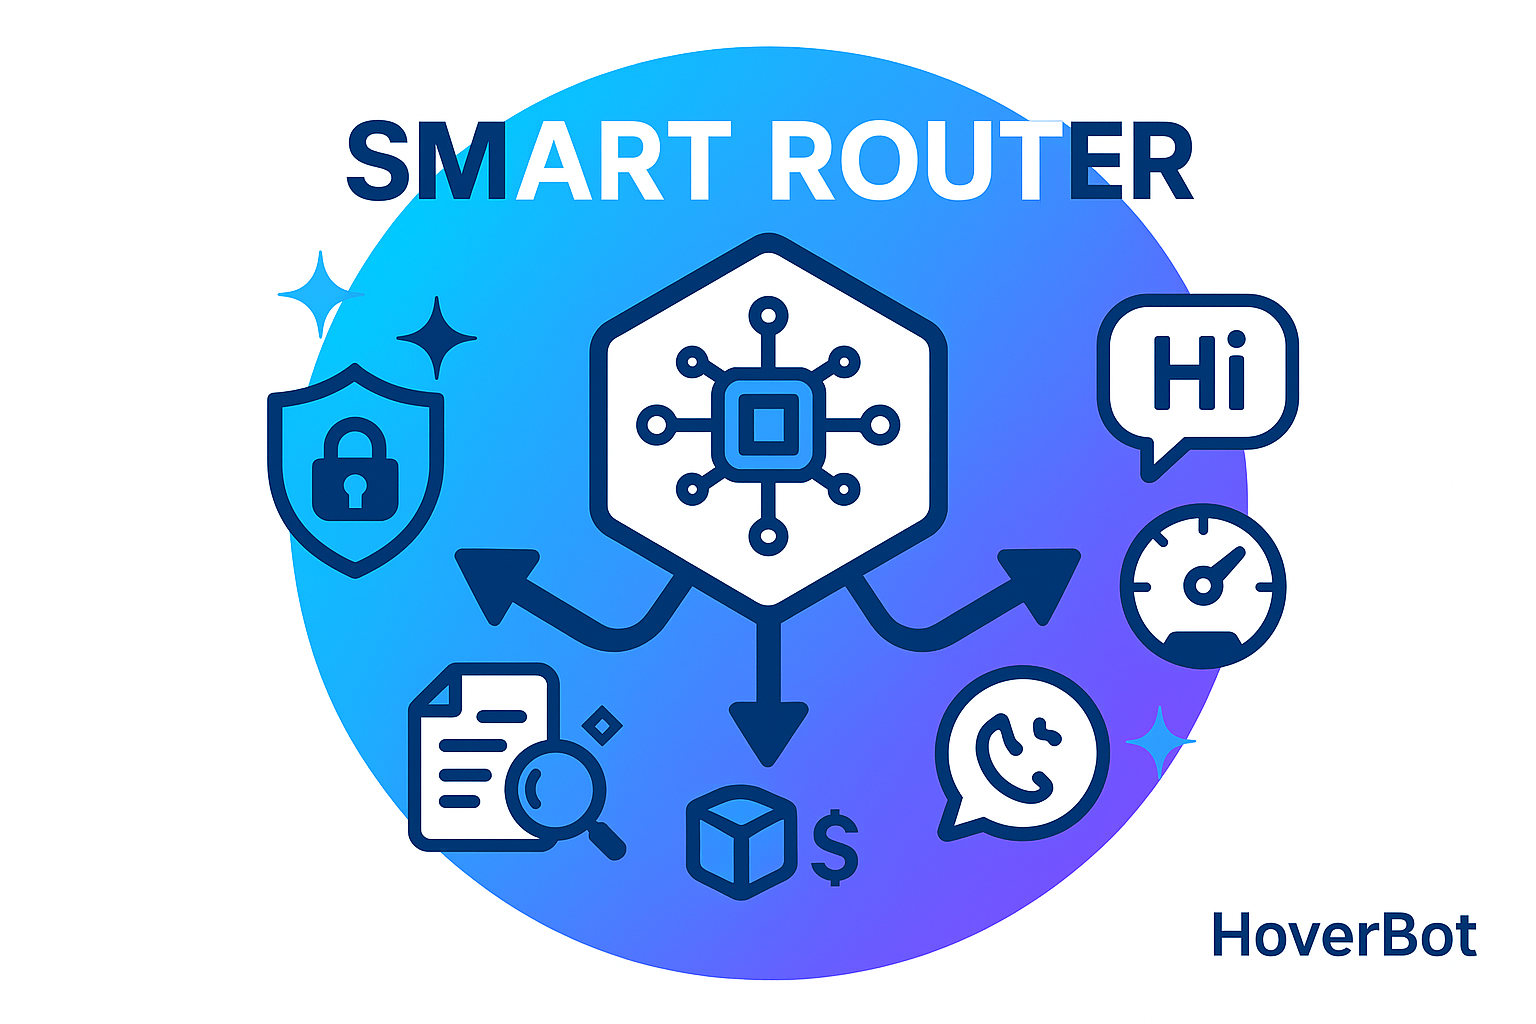
Routing Beats Bigger Models: A Production Architecture
GPT-4o costs 15x more than GPT-4o-mini. Claude Opus costs 30x more than Haiku. The question is not which model to use. The question is which model to use for each request. A smart router cuts cost 70% while improving quality.